

If markets are falling why is Momentum rising?
The answer lies in pure factor returns
By Leon Serfaty, Axioma Product Specialist
How can Momentum’s return be +0.62%1?
April 3, 2025 is not a day investors will forget any time soon. Reaction to the step change in US trade policy announced by President Trump the prior afternoon was swift and violent, with the broad US market suffering its worst day since the COVID panic of 2020 almost exactly five years ago. However, according to our factor risk models, the preliminary estimate of the Medium-Term Momentum (MTM) factor return was positive at the close of trading on that Thursday afternoon. How can this be?
A stock’s Momentum loading (or exposure) is simply the standardized rank of its excess return over the last 12 months, excluding the most recent 20 trading days. The concept is that Medium-Term Momentum represents the trend-following strategy that winning stocks will continue to win. Over the last 20 years, MTM’s annualized return is 1.47% with annualized volatility of 3.77%, for a Sharpe Ratio (factor returns are always in excess of the Risk Free Rate) of about 0.39. YTD 2025 has seen two significant drawdowns in Momentum: just after the US market peak on 19 February and another, sharper downdraft starting on the 3rd of March that appeared to catch many off guard:

Source: Axioma factor risk models, Arcana
However, the factor has appeared to recover sharply since the 10th of March as market participants anticipated the US tariff regime would not be too damaging to US growth.
But then came “Liberation Day”: the announcement by President Trump of a 10% base tariff on all countries and further, more punitive “reciprocal” tariffs usually equal to half of the tariffs imposed by those countries on US exports, announced after the market close on April 2. On April 3, the IWV ETF representing the Russell 3000 index was down nearly 5% on the day, and some of the biggest winners of the last 12 months got absolutely pummeled. Just as an example from the NASDAQ 100, Applovin (APP) had a 275.76% cumulative return over the trailing 12 months and was down 9.8% on that Thursday. Palantir was up 268% and down 4.35%. Each of them has the maximum (winsorized) Momentum loading of 3.67 – you can’t get more Momentum than that, at least in the US. So how is it that the factor return appears to be positive for April 3?
The answer may be found by looking at Pure Factor Portfolios
After the close of the market each day, the Axioma risk model machinery goes to work producing all of our risk models for the following day’s open. Perhaps the most important step is the factor return regression, where we estimate the day’s factor returns based on the estimation universe constituents’ factor loadings and their excess returns.
Without getting too deep into the math, the result of the regression is equivalent to finding portfolios with unit (1) exposures to each factor, zero to all other factors and minimal residual, or idiosyncratic return. We call these “Pure Factor Portfolios” (PFP) or “Factor Mimicking Portfolios” (FMP), and they end up being dollar-neutral long/short portfolios which take a position in every single estimation universe asset (currently about 3100 in the US). From the estimation universe weights and the factor loading matrix, we can derive the set of weights for each FMP that will be a very good estimate of the next day’s factor return.
When we return to the representation of the factor return as a long/short dollar-neutral portfolio of 3100 stocks, we can actually answer this question using simple return attribution, sorting the stocks into longs and shorts, further segmented by sectors:
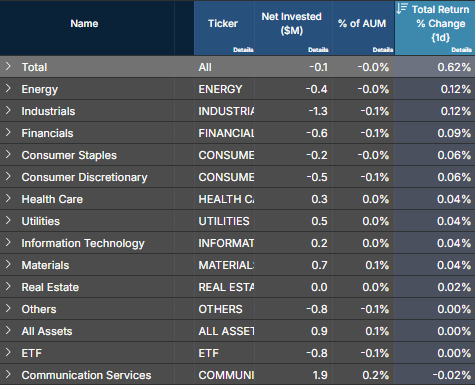
Source: Axioma factor risk models, Arcana
All sectors had positive contributions, with the exception of Communication Services. Yet, all sectors except Staples were down on the day. Drilling deeper by splitting the longs and shorts reveals the answer:
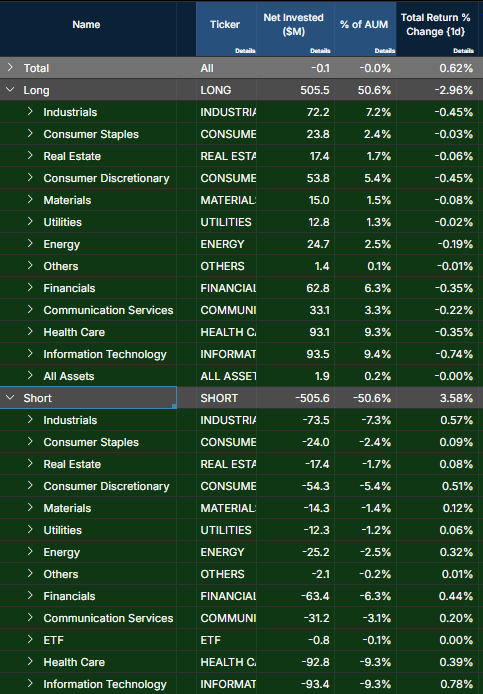
Source: Axioma equity factor models, Arcana
In every sector, the short side positive contribution exceeded the long side’s losses, with the exception of Communication Services. This simply means that the losers of the past year lost more than the winners did. As bad as the winners were, the losers were worse.
This can have some odd implications for factor-based performance attribution, as stocks with significant positive Momentum loadings will get positive contributions from their Momentum exposure on this day of spectacular losses. This will likely increase their negative idiosyncratic returns, all things being equal. However, with an understanding of why this is the case, the intuition should be a bit clearer.
1. This is the estimate for the Axioma US Equity Factor Risk Model 5.1-SH version of the factor return using a Factor-Mimicking portfolio and stock returns from 3 April 2025.


